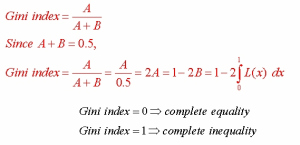
“Gini index measures the extent to which the distribution of income or consumption expenditure among individuals or households within an economy deviates from a perfectly equal distribution” [1]. A Lorenz curve plots the cumulative percentages of total income received against the cumulative number of recipients, starting with the poorest individual or household. The Gini index measures the area between the Lorenz curve and a hypothetical line of absolute equality, expressed as a percentage of the maximum area under the line. Thus a Gini index of 0 represents perfect equality, while an index of 100 implies perfect inequality.
Simply put Gini index measures the impurity of data D. Some refer to it as inequality.
Now let me show the practical example for the same in R. The package that we use here is ineq (To see the help file use ??help (ineq)) otherwise you can create your own Gini function as shown here like
gini if (!is.numeric(x))
{
	warning("'x' is not numeric; returning NA")
	return(as.numeric(NA))
}

if (any(na.ind if (!na.rm)
	stop("'x' contain NAs")
else
	x
}
	n mu N ox dd dd / (mu * N)
}
Either way, whether you use the ineq package or the aforementioned function it will give you the same result. Now, let us measure the inequality of the river Nile data. In R it can be done as follows;
> data (Nile)
> install.packages(“ineq”)
> library(ineq)
> data(Nile)
> ineq(Nile, type=”Gini”)
[1] 0.1031993
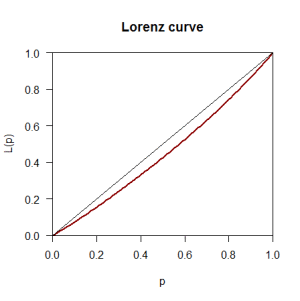
So there is 10% inequality in the Nile data. And if you want to plot this inequality you can do so by using the Lorenzo curve as given
> plot(Lc(Nile),col="darkred",lwd=2)
This will generate the given plot where the dark red line represents the inequality in the Nile data. It is worthwhile to note that Gini index computation works well for univariate categorical data but it is biased towards multi-valued attributes and has difficulty when the number of classes is large.
Reference
The World Bank. 2014. GINI index (World Bank estimate). [ONLINE] Available at: http://data.worldbank.org/indicator/SI.POV.GINI. [Accessed 18 May 15].
comments powered by Disqus