An analytical model for predicting employee flight risk behaviour
“People are the nucleus of any organization. So, how can you find, engage and retain top performers who’ll contribute to your goals, your future?”
There is no dearth of Enterprise Resource Planning (ERP) systems utilized by human resource companies, however, the inclusion of machine learning to such ERP systems can be very useful. This leads one to ask the following question.
A. Question
To develop a predictive model to understand the reasons why employees leave the organization.
B. Objectives
This report has two objectives, namely;
i. To conduct an exploratory data analysis for determining any possible relationship between the variables
ii. To develop a predictive model for identifying the potential employee attrition reasons.
C. Data Analysis
A systematic data analysis was undertaken to answer the business question and objective.
i. Exploratory Data Analysis (EDA)
The training set had 13000 observations in 11 columns. The test set had 1999 observations in 10 columns. There were zero missing values. I now provide the following observations;
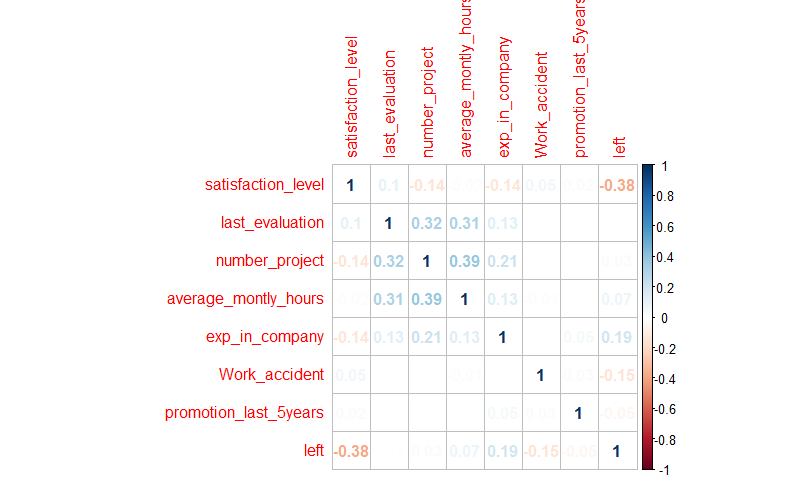
Fig-1: Correlation plot
a. I renamed some variables like “sales” was renamed to “role”, “time_spend_company” was renamed to “exp_in_company”.
b. The employee attrition rate was 21.41%
c. The company had an employee attrition rate of 24%
d. The mean satisfaction of employees was 0.61
e. From the correlation plot shown in Fig-1, there is a positive (+) correlation between projectCount, averageMonthlyHours, and evaluation. Which could mean that the employees who spent more hours and did more projects were evaluated highly.
f. For the negative (-) relationships, employee attrition and satisfaction are highly correlated. Probably people tend to leave a company more when they are less satisfied.
g. A one-sample t-test was conducted to measure the satisfaction level.
- Hypothesis Testing: Is there significant difference in the means of satisfaction level between attrition and the entire employee population?
1.1. Null Hypothesis: (H0: pEmployeeLeft = pEmployeePop) The null hypothesis would be that there is no difference in satisfaction level between attrition and the entire employee population.
1.2. Alternate Hypothesis: (HA: pEmployeeLeft!= pEmployeePop) The alternative hypothesis would be that there is a difference in satisfaction level between attrition and the entire employee population.
Findings
- The mean for the employee population is 0.618
- The mean for attrition is 0.439
I then conducted a t-test at 95% confidence level to see if it correctly rejects the null hypothesis that the sample comes from the same distribution as the employee population.
Findings
- I rejected the null hypothesis because the t-distribution left and right quartile ranges are -1.960. The T-score lies outside the quantiles and the p-value is lower than the confidence level of 5%.
- The test result shows the test statistic “t” is equal to 0.36. This test statistic tells us how much the sample mean deviates from the null hypothesis. The alternative hypothesis is True as the mean is not equal to 0.61.
Inference
From the above findings does not necessarily mean the findings are of practical significance because of two reasons, namely; collect more data or conduct more experiments.
h. Now let’s look at some distribution plots using some of the employee features like “Satisfaction”, “Evaluation” and “Average monthly hours”.
Summary: Let’s examine the distribution on some of the employee’s features.
Here’s what I found:
- Satisfaction There is a huge spike for employees with low satisfaction and high satisfaction.
- Evaluation There is a
bimodaldistribution of employees for low evaluations (less than 0.6) and high evaluations (more than 0.8) - AverageMonthlyHours There is another bimodal distribution of employees with lower and higher average monthly hours (less than 150 hours & more than 250 hours)
- The evaluation and average monthly hour graphs both share a similar distribution.
- Employees with lower average monthly hours were evaluated less and vice versa.
- If you look back at the correlation matrix, the high correlation between
evaluationandaverageMonthlyHoursdoes support this finding. Note: Employee attrition is coded as1and no attrition is coded as0.
i. The relationship between Salary and Attrition
- Majority of employees who left either had low or medium salary.
- Barely any employees left with high salary
- Employees with low to average salaries tend to leave the company.
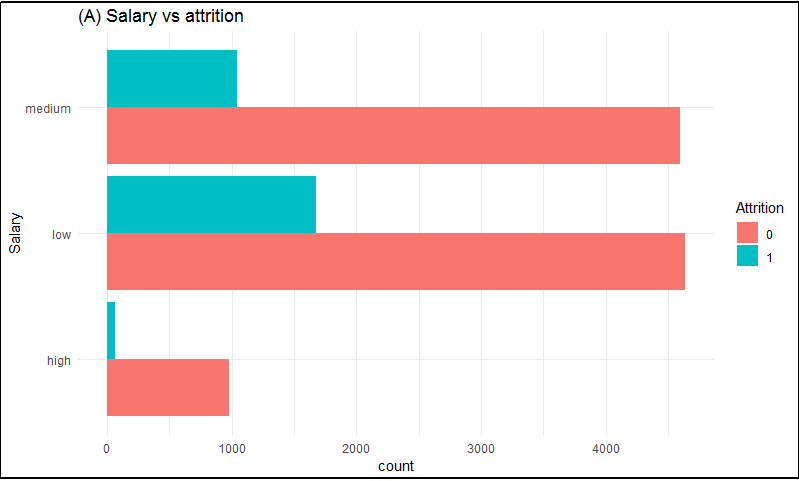
Fig-2: Salary vs Attrition plot
j. The relationship between Department and Attrition
- The sales, technical, and support department were the top 3 departments to have employee attrition.
- The management department had the least count of attrition.
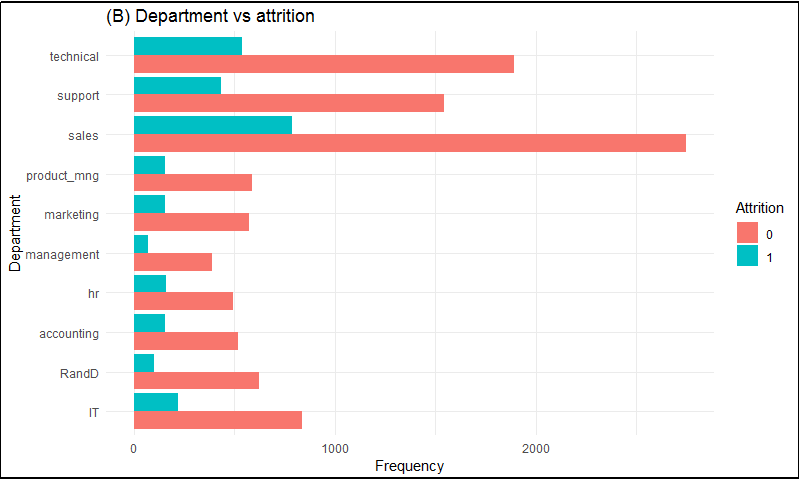
Fig-3: Department vs Attrition plot
k. The relationship between Attrition and ProjectCount
- More than half of the employees with 2,6, and 7 projects left the company.
- Majority of the employees who did not leave the company had 3, 4, and 5 projects.
- All of the employees with 7 projects left the company.
- There is an increase in employee attrition rate as project count increases.
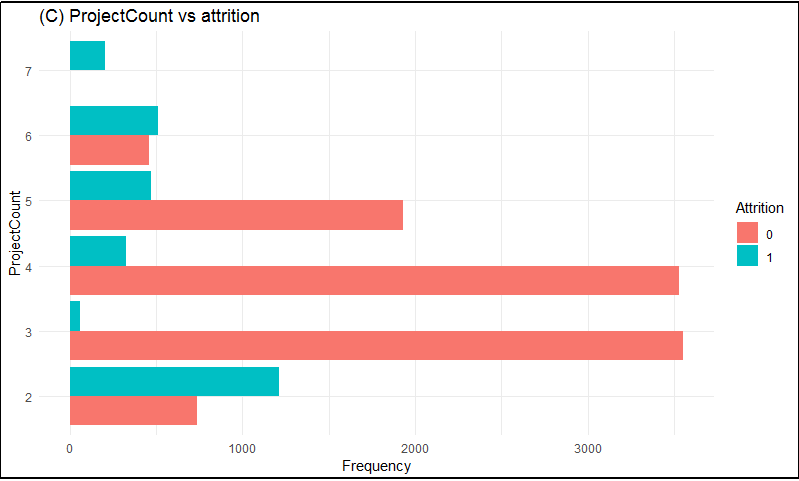
Fig-4: Project count vs Attrition plot
l. The relationship between Attrition and Evaluation
- There is a bimodal distribution for attrition.
- Employees with low performance tend to leave the company more.
- Employees with high performance tend to leave the company more.
- The sweet spot for employees that stayed is within 0.6-0.8 evaluation.
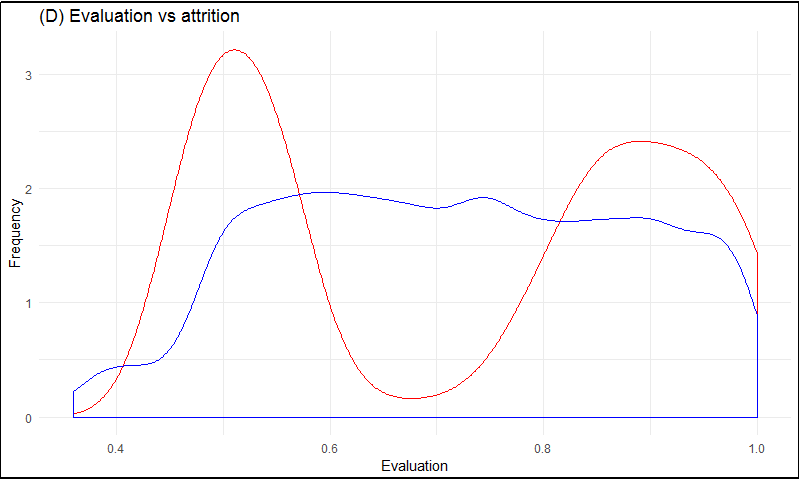
Fig-5: Employee evaluation vs Attrition plot
m. The relationship between Attrition and AverageMonthlyHours
- Another bi-modal distribution for attrition.
- Employees who had less hours of work (~150hours or less) left the company more.
- Employees who had too many hours of work (~250 or more) left the company.
- Employees who left generally were underworked or overworked.
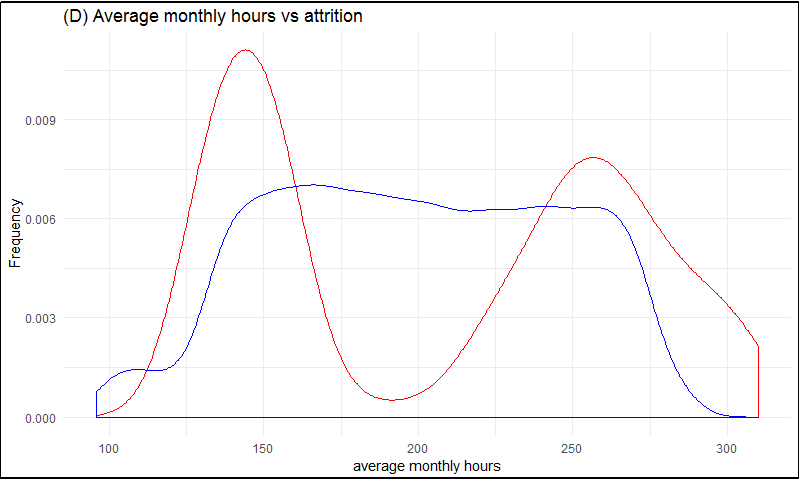
Fig-6: Average monthly hour worked vs Attrition plot
Key Observations: The Fig-7, clearly represents the factors which serve as the top reasons for attrition in a company:
- Satisfaction level: it already had a negative correlation with the outcome. People with low satisfaction were most likely to leave even when compared with evaluations.
- Salary and the role they played has one of the least impact on attrition.
- Pressure due to the number of projects and how they were evaluated also holds key significance in determining attrition.
- All features were deemed important.
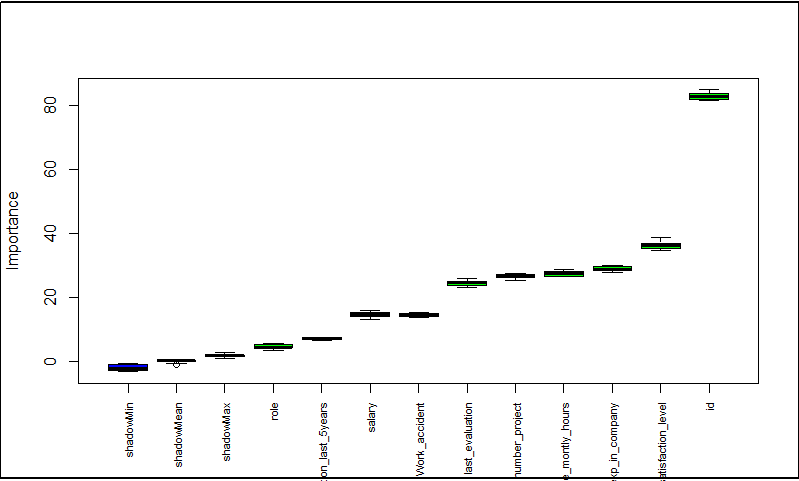
Fig-7: Feature importance plot
- Data modeling
Base model rate: recall back to Part 4.1: Exploring the Data, 24% of the dataset contained 1’s (employee who left the company) and the remaining 76% contained 0’s (employee who did not leave the company). The Base Rate Model would simply predict every 0’s and ignore all the 1’s. The base rate accuracy for this data set, when classifying everything as 0’s, would be 76% because 76% of the dataset are labeled as 0’s (employees not leaving the company).
The training data was split into 75% train set and 25% validation set. An initial logistic regression model based on all 10 independent variables (or features) was built on the train set. The model was tested on the validation set. An initial predictive accuracy of 78% was obtained.
Thereafter, I built four models based on the following classifiers, namely:
a. Classification And Regression Trees (CART),
b. Support Vector Machine (SVM),
c. k-nearest neighbor (knn) and
d. logistic regression
The CART, SVM and the KNN model gave an accuracy of over 98% on the training set. I chose the CART and the SVM model for testing. Both models yield an accuracy of 95.5% on the validation set, as shown in Fig-8.
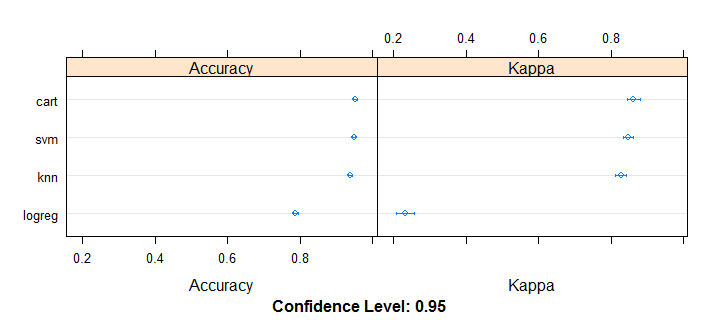
Fig-8: Predictive modeling results
From Fig-8, I chose the cart model as the final model. Thereafter, I tested this model on the hr_attrition_test data. Finally to conclude using the cart modeling technique, we can predict the employee attrition at an accuracy of 95.5%.
Summary
- Employees generally left when they are underworked (less than 150hr/month or 6hr/day)
- Employees generally left when they are overworked (more than 250hr/month or 10hr/day)
- Employees with either really high or low evaluations should be taken into consideration for high attrition rate
- Employees with low to medium salaries are the bulk of employee attrition
- Employees that had 2,6, or 7 project count was at risk of leaving the company
- Employee satisfaction is the highest indicator for employee attrition.
- Employee that had 4 and 5 years at the company should be taken into consideration for high attrition rate
Code and Dataset
-
R code - Exploratory Data Analysis, Predictive Modeling
-
Data - train data, test data