Today, I will discuss on how to create a dissimilarity matrix for mixed type dataset. A quick recap of what a dissimilarity matrix and mixed type dataset is should be good enough to grab your attention.
Let me begin the discussion with the following question,
Question: What is Similarity and Dissimilarity measure?
Answer: Similarity measure is a numerical measure on how similar are two objects. It often falls between 0 (meaning no similarity) and 1 (meaning completely similar).
Dissimilarity measure is a numerical measure on how different or dissimilar are two objects. Its range is inverse of similarity. 0 (meaning completely similar) and infinity (meaning no similarity). There is an excellent tutorial on this that can be found here.
I will work with the mixed data set from the UCI Machine Learning repository that can be found here. The dataset has 1473 attributes in 10 objects. Please note that this dataset is already standardised and scaled. However, real world dataset when given to you for analysis may or may not be scaled. Its then you will have to do all the dirty work.
Step 1: I load the dataset in R and name the dataframe as cmc
Step 2: I now create a dissimilarity matrix by using the distance function of the cluster package as (Note: if package cluster is not loaded then you can load it as;
> library("cluster")
> cmcTrain.dis=dist(cmc, method="euclidean")
cmcTrain.matx=as.matrix(cmcTrain.dis)
Step 4: Now, I can apply any clustering algorithm to this dissimilarity matrix. for example, if I want to apply agglomerative hierarchical clustering</div>
I will do it as;
> cmcTrain.hc=agnes(cmcTrain.matx,diss=TRUE,metric="euclidean",stand="TRUE",method="average")
Notice parameter diss=”TRUE” because cmcTrain.matx is a dissimilarity matrix</pre>
I will now plot it as
> plot(cmcTrain.pamx)
Similarly, I can apply the Partition Around Medoids (PAM) clustering algorithm as
> cmcTrain.pamx=pam(cmcTrain.matx, 2,diss="TRUE",metric="euclidean")
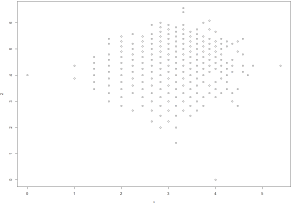
I will now plot it as > plot(cmcTrain.pamx)
And the resultant plot is;
So you see the important is data pre-processing followed by data scaling and standardisation and after that you can apply whatever clustering or classification algorithm to it and interpret the results accordingly.
comments powered by Disqus